Editor’s note: The following was posted on Medium by Martin Schierle, Mobile Solutions Consultant at Google.
Accelerated Mobile Pages (AMP) are a great and easy way to build very fast pages, and as we know speed is key — for every second delay in mobile page load, conversions can fall by up to 20%. So obviously the first thing people do after they built their first AMP is to A/B test it, sometimes just to find out it may not perform well…

In fact it’s not as trivial to test AMP as it may seem at first. There are a few things to be aware of when you go down the AMP path of speed, and by keeping these in mind you should be just fine!
Target Metrics
When testing AMP, different audiences often look for different metrics. Conversions are often a good target, but it’s important to keep in mind that AMP will have less impact the farther the conversion is from the AMP page. If the conversion is at the end of a 10 screen purchase funnel, it may not help much to just AMP the initial landing page, when the user might still have to navigate through nine slow pages afterwards to finish the conversion. For publishers, ad revenue is a compelling metric, but it’s often overlooked that the incremental uplift through AMP will not necessarily be seen in CPM, but rather in traffic and user engagement. For publishers it therefore makes more sense to look at revenue per session, rather than just revenue per page.
One of the most interesting and misleading metrics is the bounce rate. As page speed is directly correlated to bounce rates, and bounce rates very often directly correlate to conversions and ad revenues, this is what most people look out for when testing AMP.
And — surprise! — it’s more than likely that you’ll see higher bounce rates when testing AMP!


But why?
Survivorship Bias
It is said that when the British army introduced metal helmets in WW1, the rate of head injuries increased afterwards — which seems more than puzzling. However, giving more thought to it the reason becomes clear — a lot of the soldiers who would have died without a helmet now survived (and thus, the number of absolute injuries went up). This effect is called the survivorship bias — you only measure the ones which survived, thereby introducing bias.
The same frequently happens for slow websites — your analytics package of choice might kick in really late during the loading process, and will only measure the users which made it that far. The users bouncing before analytics fires are not seen and not measured.
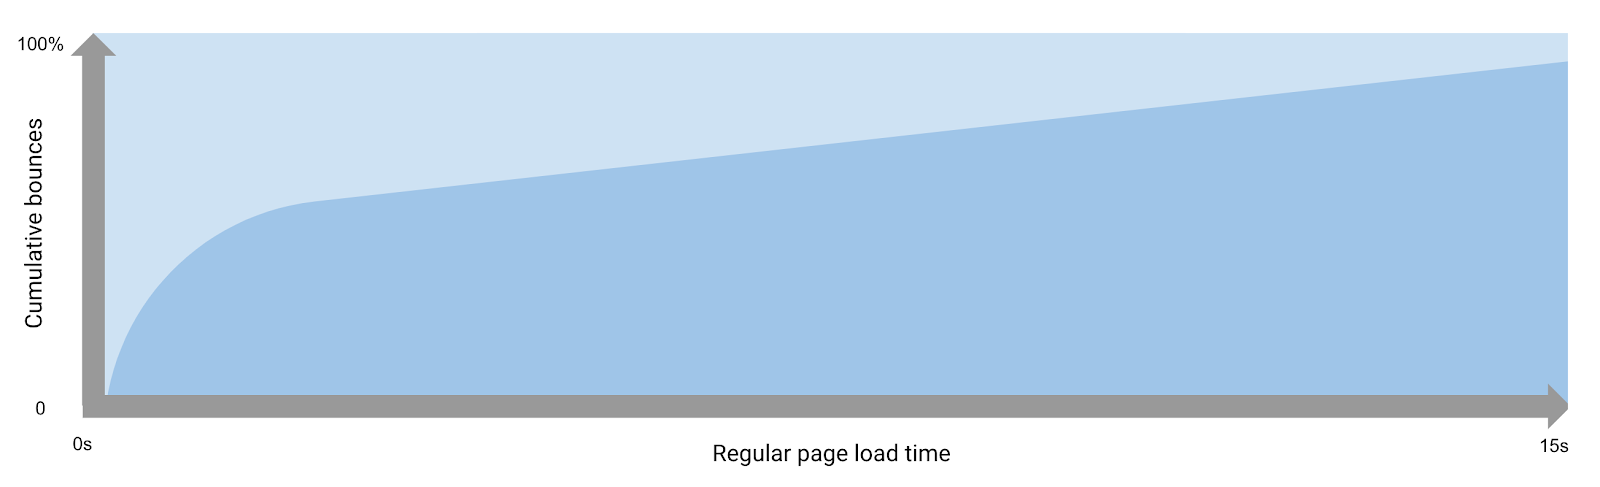
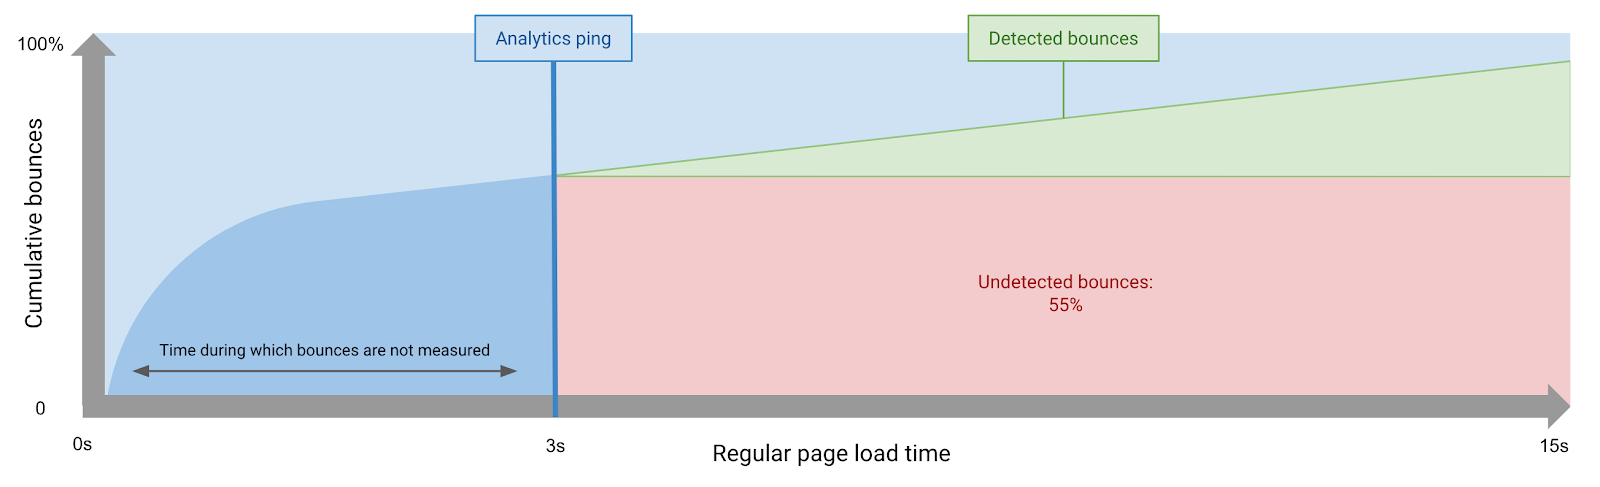
Consider this graph showing the cumulative bounces over the total load time of an example page.
This page loads in 15 seconds.

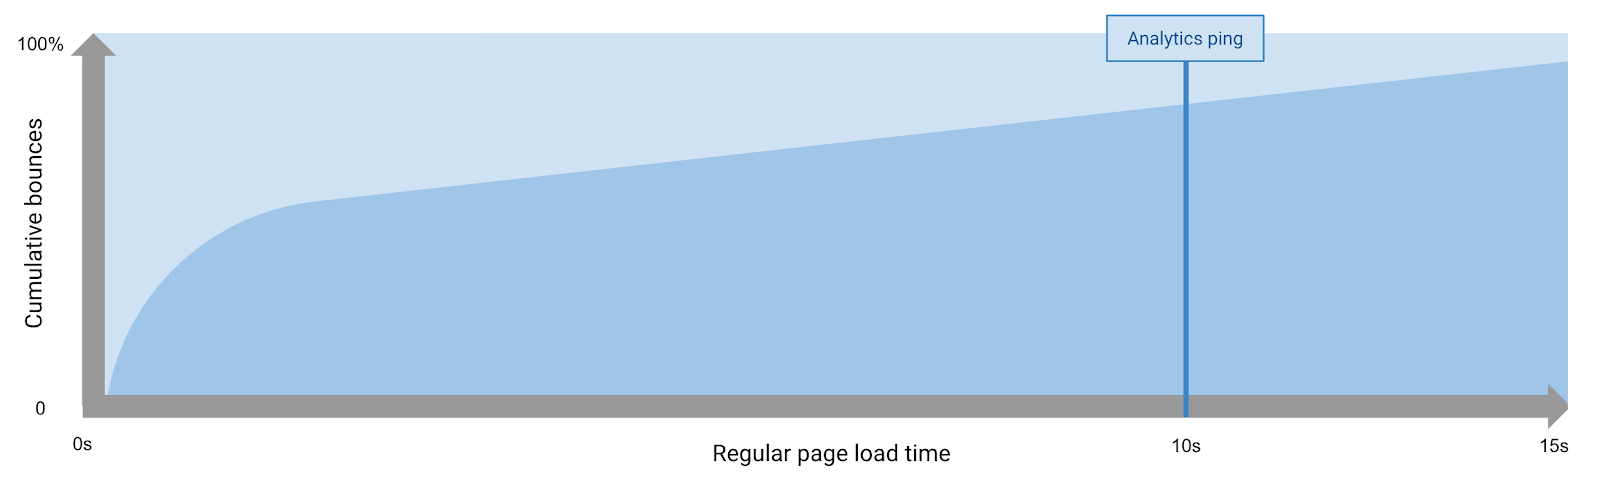
We add the moment in time when the Analytics provider fires the first ping: 10 seconds.
This means that we are only measuring 20% of the visitors that are bouncing before the page is fully loaded.
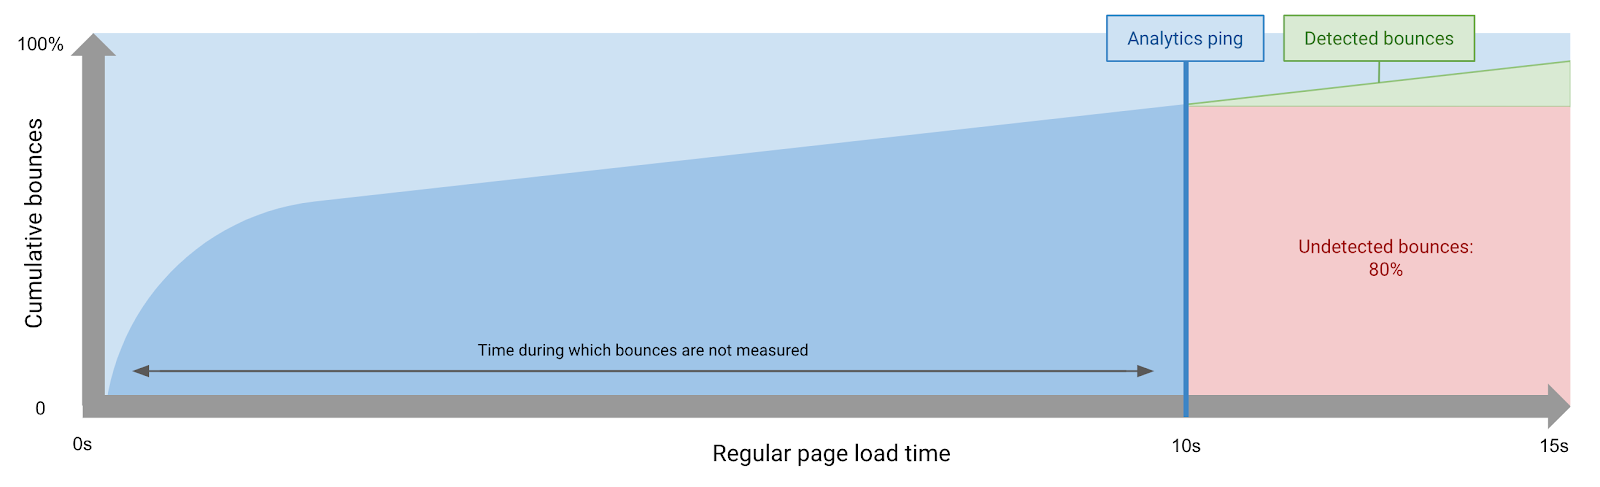
If we would fire the analytics ping after 3 seconds, we’d measure 45% of the visitors that bounce before the page is fully loaded.
When putting the load times and analytics pings next to one another, we can see that the AMP page measures more of the bounces that are happening.

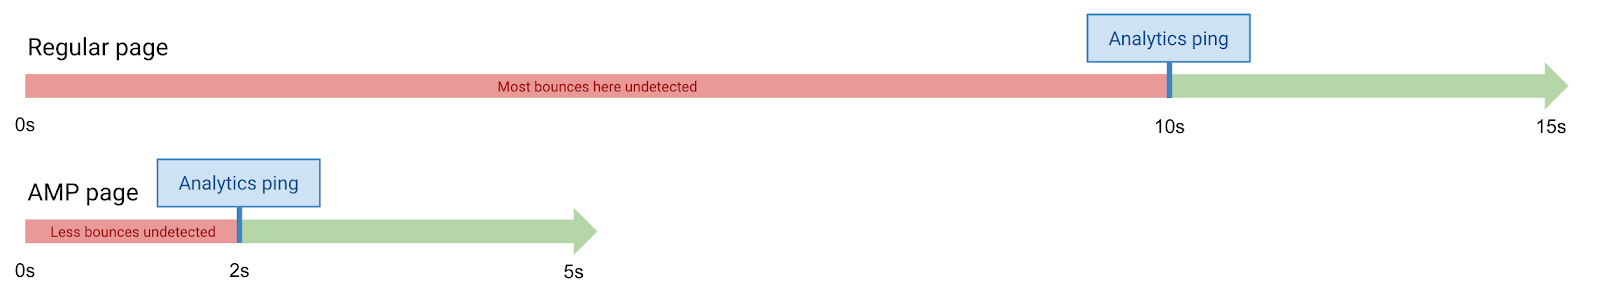
Even if AMP outperforms the normal page, the measured bounce rate might still be higher, since we capture more of the bouncing traffic. You can solve this by improving analytics load time on canonical, or by measuring real load abandonment as described here.
The Low Bar


In a time where most websites are too slow, it often takes really dedicated users to complete a purchase funnel on mobile — whoever is willing to wait ten or twenty seconds for a website to load, is probably very determined to finish the task she came for. So if AMP gets introduced, relative conversions might seem to go down — as the bar is now so low, that even less dedicated, loyal or interested users make it to your website who might convert less frequently. Be aware that this is still incremental traffic and incremental conversions, just that the relative conversion probability might seem lower. In these cases it might be worthwhile to also look at absolute conversions and general traffic.
App Users


Many websites offer an alternative native app which shows the same content as the website, and the mobile phone might open up the native app for URLs to this domain (but not for the same content on AMP cache). So if an app user visits a page on the AMP cache and then clicks through to regular website, the native app will open instead. As most analytics packages define a bounce as a session with only one hit, such a user flow would count as bounce — even though the user didn’t bounce but potentially finished her journey successfully in the native app.
Luckily, this scenario only applies for companies with a high app penetration in the market, but is still important to keep in mind.
Visual and Functional Parity
Historically many websites implemented AMP as a parallel version of their website, as a fast entry point from search (‘paired AMP’). In some of these cases AMP was intentionally or unintentionally not equivalent to the regular page — maybe due to oversight, maybe to save resources, or maybe the two versions got out of sync over time. However — given most companies are going through massive efforts and A/B testing to get their landing pages as optimized as possible, it seems obvious that the AMP version of the same page might not perform well, if not being functionally and visually identical (at least with respect to all critical content and user actions). For a fair A/B test, the pages need to be comparable. From a visual perspective you can use the Chrome screenshot tool to create screenshots of AMP and canonical, and compare them manually or through an image diff tool (there are many available, e.g. this one). From a functional perspective it’s worth clicking through the main user actions on both versions, and make sure they feel and behave the same way — look out especially for autofills, autocompletes, search auto correction etc.
Interaction Events
There are certain user actions on a website, which you might want to count as a successful page visit (e.g. watching a video, filling a lead form etc.). Normally a page visit with such actions is not counted as a bounce, even when the user directly leaves the page afterwards. Within Google Analytics these events are called ‘interaction events’ in contrast to ‘non-interaction events’, where a bounce is still counted. So if the regular website has many interaction events defined, but the AMP site not, this will directly influence bounce rates of both versions, and will make them impossible to compare. For Google Analytics this can be verified easily for both versions via the Google Tag Assistant Extension.
User IDs
Two of the core value proposition points of AMP are AMP Caches and Prerendering. However, the delivery from the AMP cache means the initial landing page is delivered from a different host than the regular site. Given that most analytics vendors are using first party cookies (due to third party blocks as e.g. introduced through Safari’s ITP), it means a user will be assigned two different cookies with two different user ids on her journey from AMP to canonical website. This is known to (artificially) inflate user ids, sessions and bounce rates, and is explained in more detail here.


The solution is to have a unique user ID across both hosts — AMP offers this with its AMP Linker, which can be integrated by 3rd party analytics vendors, and is also integrated in Google Analytics. However — not all analytics vendors support this, and if not implemented correctly it may fail. Then the AMP visit would be erroneously counted as a bounce, as the same user wasn’t seen again on canonical. So it’s important to verify that your analytics package is sending and using a consistent client id across AMP cache and canonical — this can be verified manually through Chrome DevTools or potentially dedicated troubleshooting tools from your analytics vendors. For Google Analytics, this can be easily checked with the Tag Assistant recording feature. Here you can navigate from search result page to AMP from cache to canonical, and then doublecheck in the recording that there is only one user session counted, which started on the AMP page, and uses the same user ids across all page hits.
Checklist
So what are the things to keep in mind when testing and evaluating AMP?
- Make sure to verify visual and functional parity (e.g. through Chrome screenshot tool and by trying all CTAs).
- Make sure that analytics on regular mweb doesn’t fire much later than on AMP, and stay aware of the blind spot and the survivorship bias.
- Make sure to not measure against a goal which happens much later in the funnel after the AMP page. If you measure conversions, try to focus on those happening on AMP itself (e.g. clickout).
- Be sure to keep in mind the bias through your native app, in case it has significant market penetration.
- Click through the whole journey from search to regular mweb, and verify that your analytics records only one user session, which starts on AMP, and uses a consistent user ID. You can do this via dedicated troubleshooting tools from your analytics provider (if available), via Chrome DevTools (look out for user identifiers in analytics pings) or via the Tag Assistant recording feature for Google Analytics.
Posted on Medium by Martin Schierle, Mobile Solutions Consultant at Google