Web Stories are a new way of telling stories on the open web. The stories are hosted on your domain, and the format allows you to add assets best suited for the job. Since the 2017 launch, we’ve seen many, many, many examples of engaging and informative stories published to the web.
Analytics capabilities of Web stories
Web Stories use amp-analytics, the same robust measurement tool behind billions of AMP pages. Publishers can instrument their stories using simple JSON configuration, and the component does the setup, collection and reporting of metrics. If you’re using one of the 75+ analytics vendors that are already integrated with AMP, you can start collecting insights with very minimal setup.
Understanding user-behavior
A typical user-journey for a website is very different from stories. On a website a user might read the headline, scroll to the bottom of the page, interact with a form before clicking on a link to the next page. Stories occupy the full viewport and users do not scroll but tap to move forward.

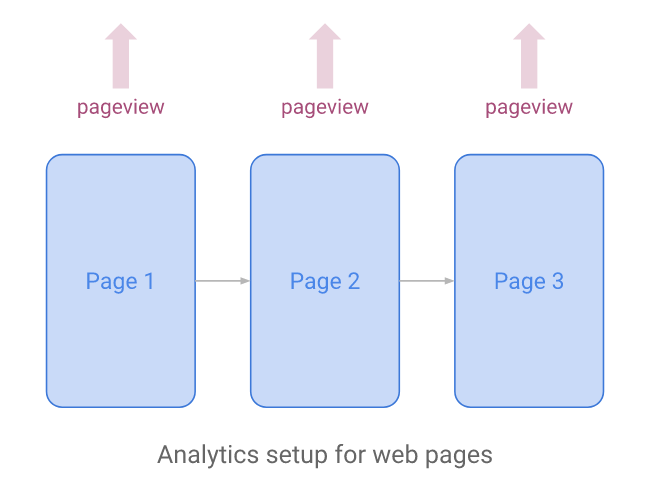
Many in the web analytics community would consider each new page in the story as a new pageview because the content from screen to screen is substantially different. However, as we just covered, the page is just a single element in a full story — and a user usually needs to see many pages to get a full sense of the story. Thus, the question of how we count something as simple as the pageview has enormous implications for our analytics approach. As you see from above, treating every new story page as a pageview could be perceived as inflated metrics.
A better default configuration

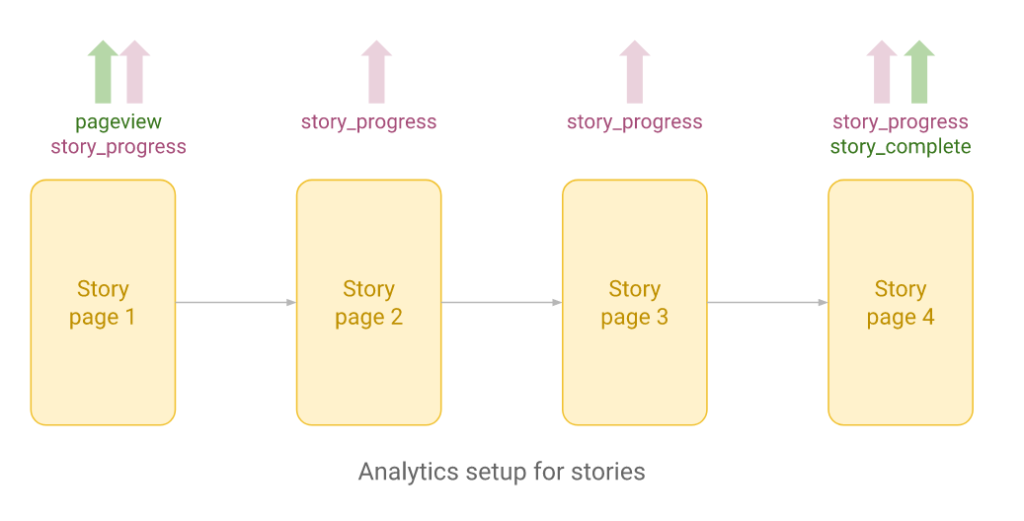
AMP Analytics makes it easy to implement the above using any analytics vendor. For instance, with Google Analytics’ Global Site Tag it looks like so –
<amp-analytics type="gtag" data-credentials="include">
 <script type="application/json">
   {
     "vars": {
       "gtag_id": "YOUR_GOOGLE_ANALYTICS_ID",
       "config": {
         "YOUR_GOOGLE_ANALYTICS_ID": {
           "groups": "default"
         }
       }
     },
     "triggers": {
       "storyProgress": {
         "on": "story-page-visible",
         "vars": {
           "event_name": "custom",
           "event_action": "story_progress",
           "event_category": "${title}",
           "event_label": "${storyPageId}",
           "send_to": ["YOUR_GOOGLE_ANALYTICS_ID"]
         }
       },
       "storyEnd": {
         "on": "story-last-page-visible",
         "vars": {
           "event_name": "custom",
           "event_action": "story_complete",
           "event_category": "${title}",
           "send_to": ["YOUR_GOOGLE_ANALYTICS_ID"]
         }
       }
     }
   }
 </script>
</amp-analytics>
This default config should give you a complete working configuration for your Web Stories.
If you’re interested in going beyond what the default config can give you, read on to find more advanced use cases with Google Analytics.
Advanced setups
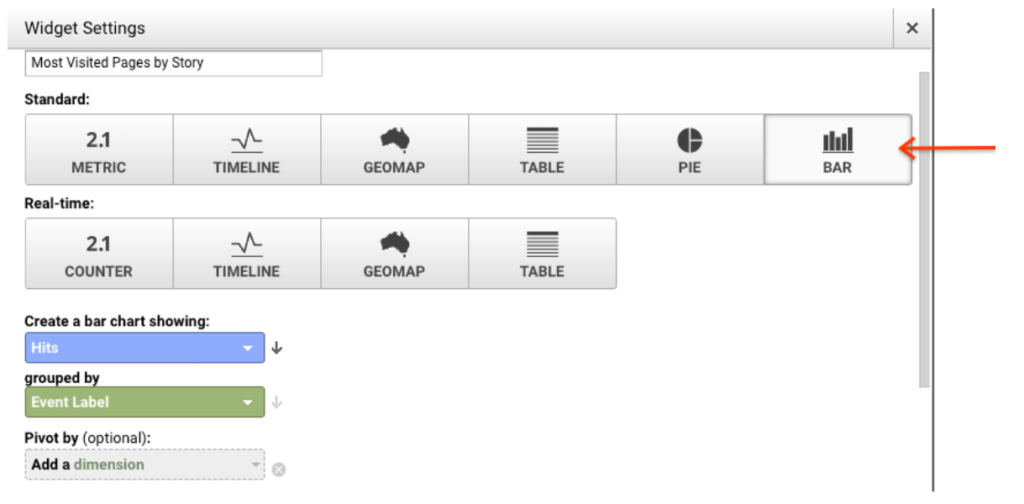
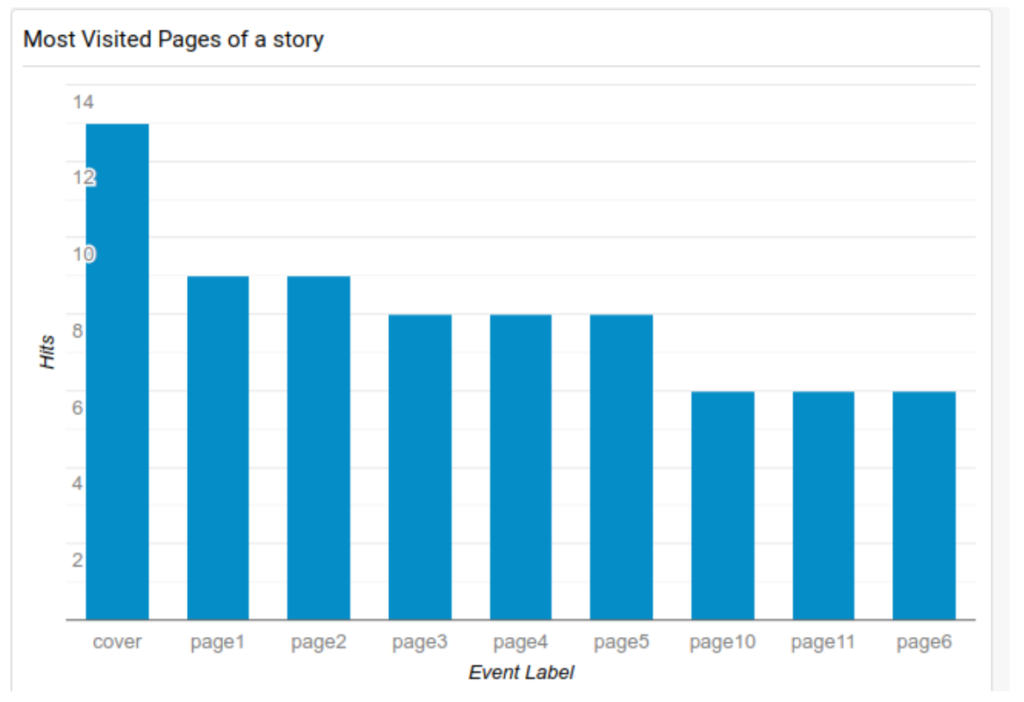
Insight #1: What’s my most visited page/slide for a given story?
Create a dashboard in Google Analytics’ web interface by going to Customization > Dashboard
Assuming you assign unique names to your Web Stories in “event_category”: “Title of my story”, we can see what pages were visited mostly by creating a bar graph in your custom dashboard picking dimensions “event_category”, “event_label” and metrics “Hits”.
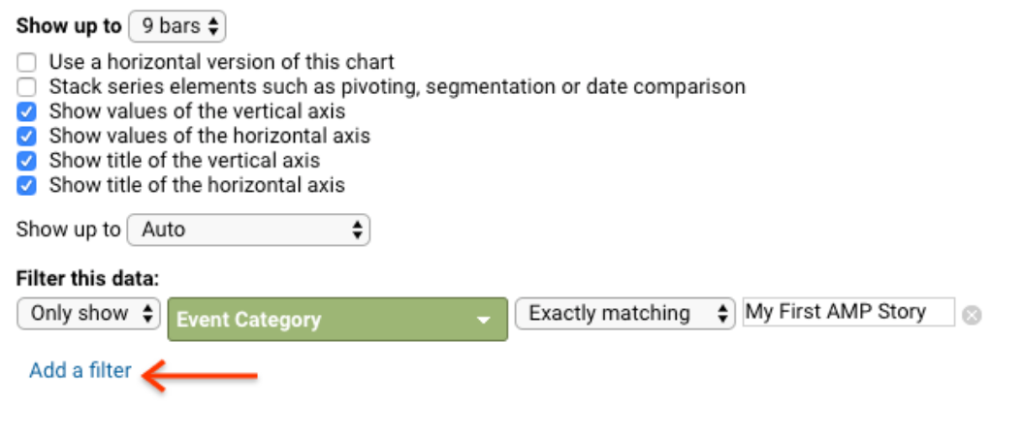
Make sure to add a filter so that you are filtering “Event Action” to exactly match “story_progress”:


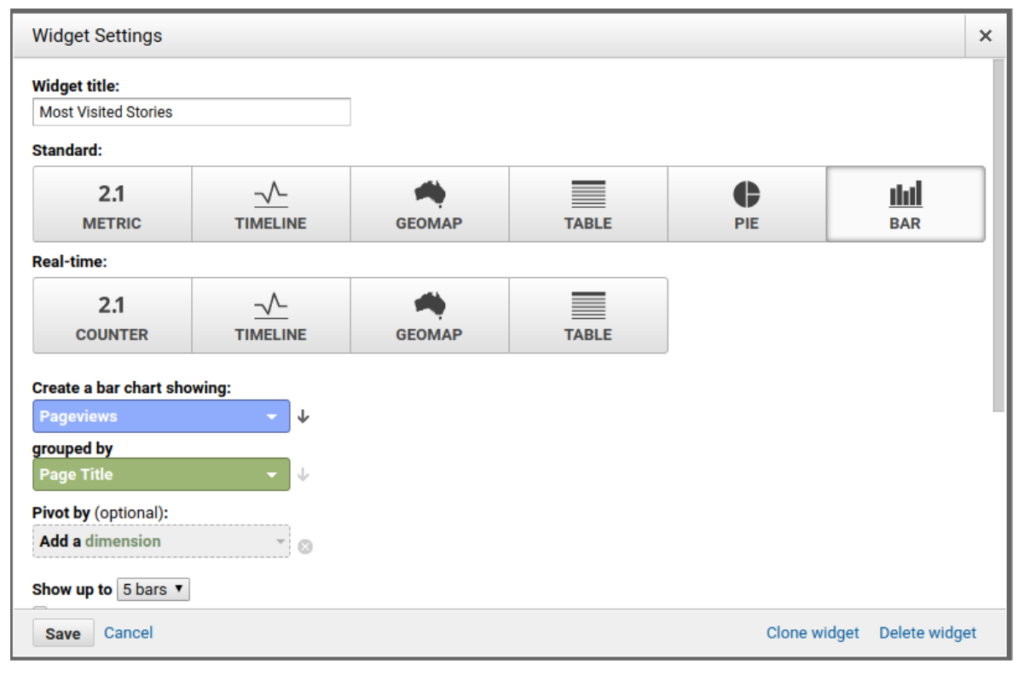
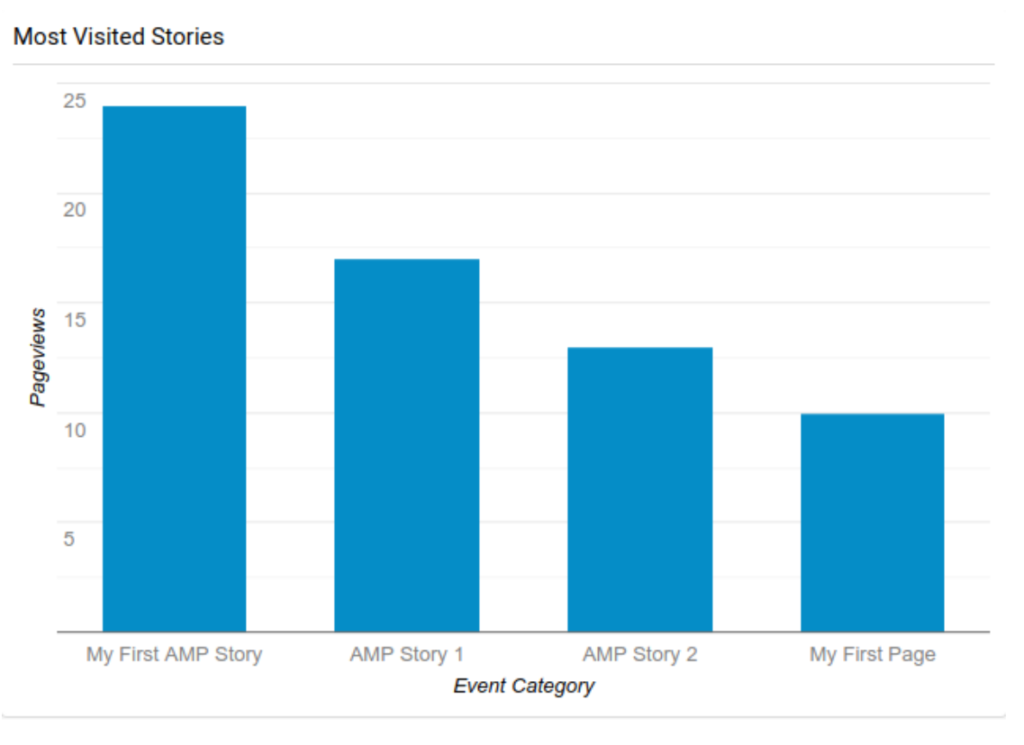
Insight #2 What’s my most visited story across the site?
Create a dashboard in Google Analytics’ web interface by going to Customization > Dashboard.
Assuming you assign unique names to your Web Stories inside your <title></title> tag pair, , we can see most commonly visited pages by creating a bar graph in your custom dashboard picking a grouped by dimension “Page Title”, and choosing the metrics “Pageviews”.


Get started quickly by using this premade Google Analytics template.
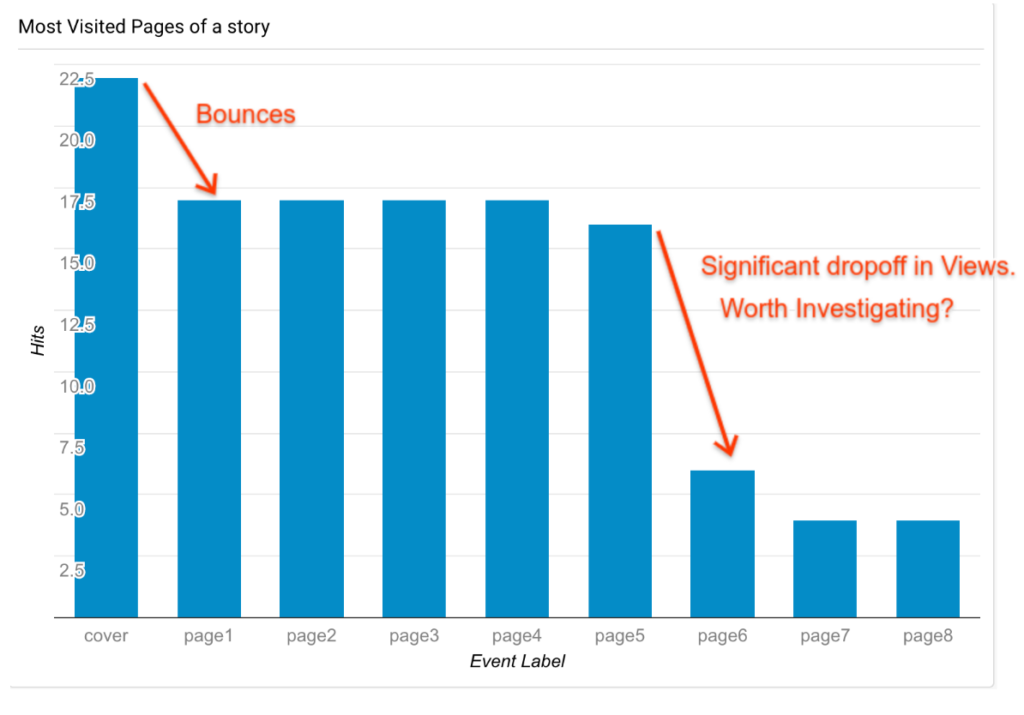
Insight #3 : For a given story, how far into the story users typically go
Since the story progresses from slide 1 to slide N, it is natural that slide 1 is seen by almost everyone, slide 2 a little less and the number progressively goes down. If there are any problematic slides, you will see a dramatic drop in slide viewership from the previous one. The following dashboard will help you visually capture any problematic pages.
You can use the dashboard that you created before ( Insight 1 : Most visited pages by story) to visually capture this

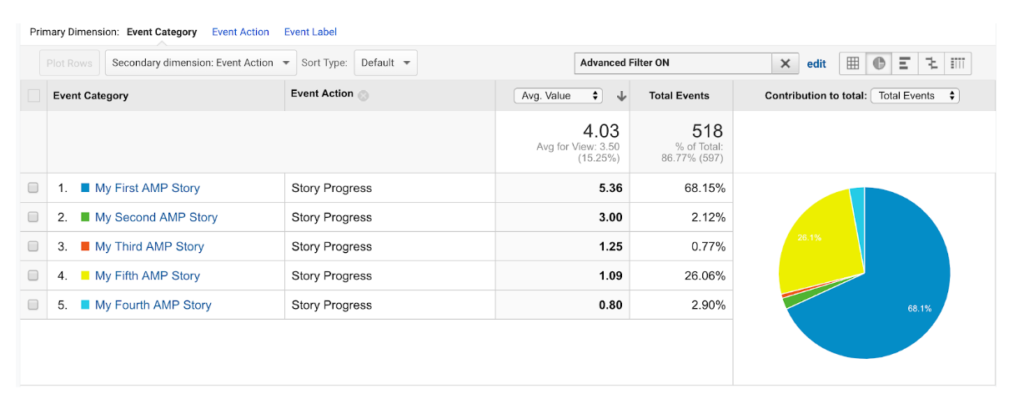
Insight #4: What’s the average number of pages my users see per story?
It is also possible to track events on an average. For instance, story progress can be used to track average story depth.
- Navigate to Behavior > Events > Top Events.
- With “Event Category” as the primary dimension, click on the pie chart icon.
- Add a Secondary Dimension as “Event Action”.
- Click on Advanced. Select “Event Action” and select “Story Progress” in the filter and apply.
- Select “Avg. Value” from the drop down.

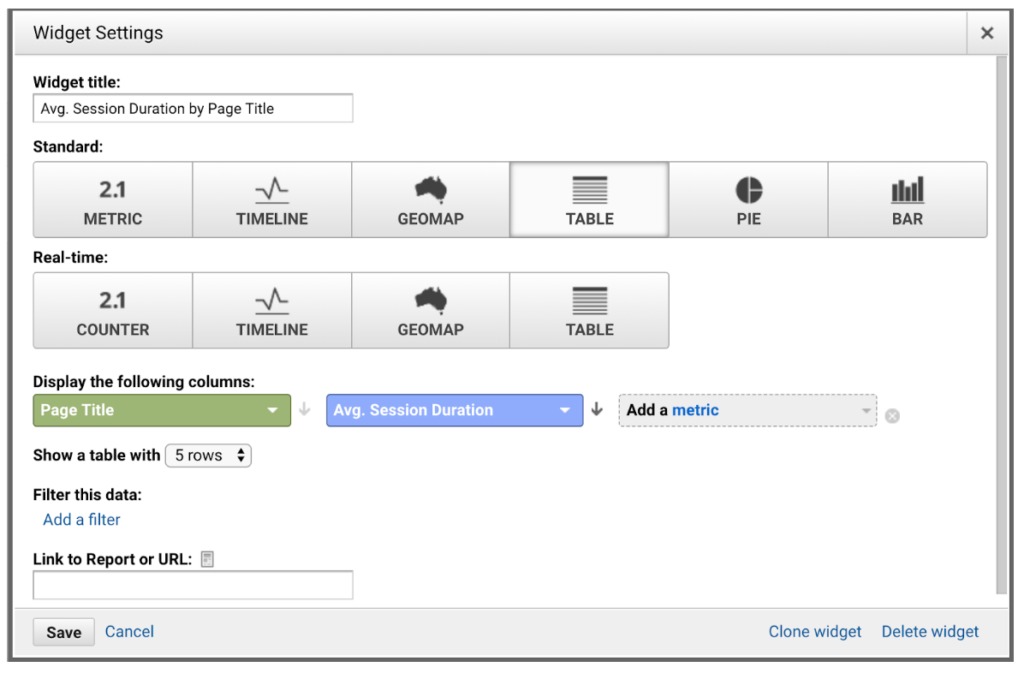
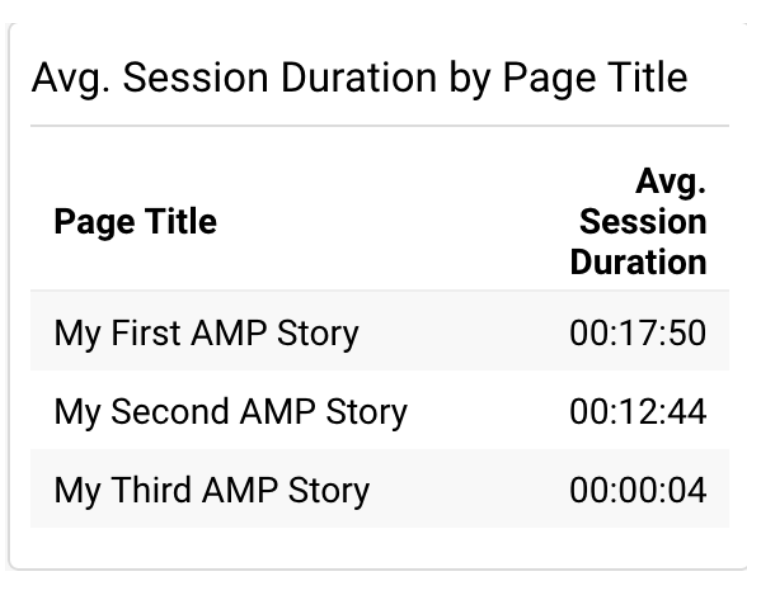
Insight #5: How long on average do users spend on my stories
Average session duration is the total duration of all sessions (in seconds) / number of sessions.
Create a new dashboard or add a widget to an existing one with the following setup


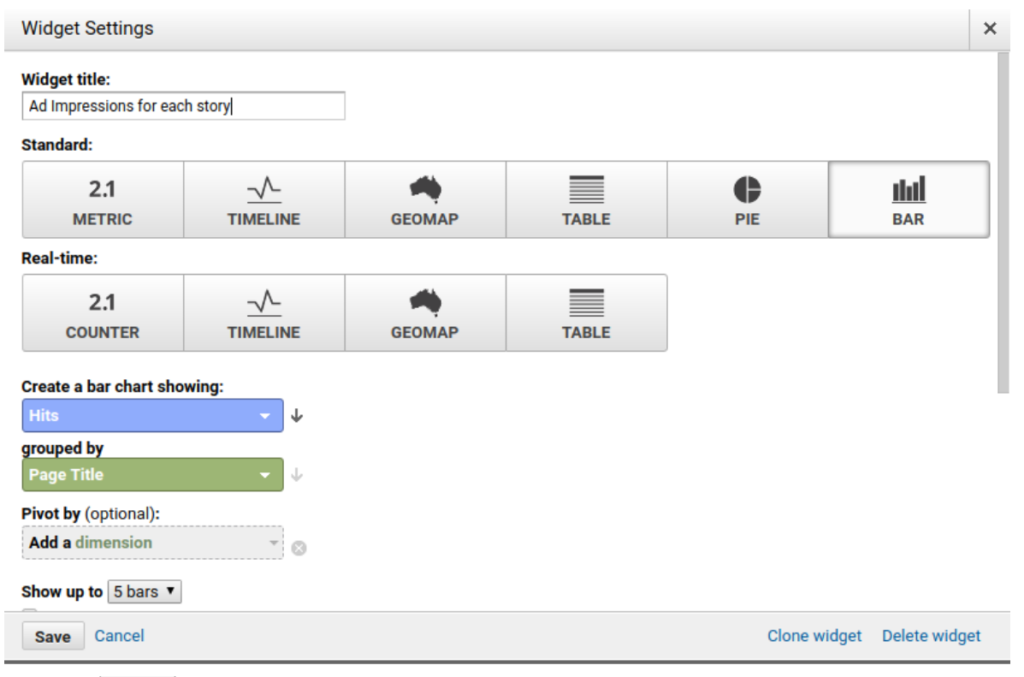
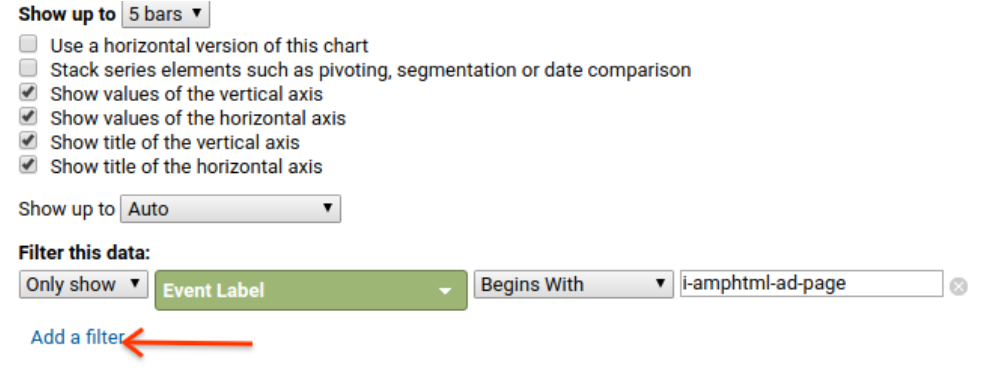
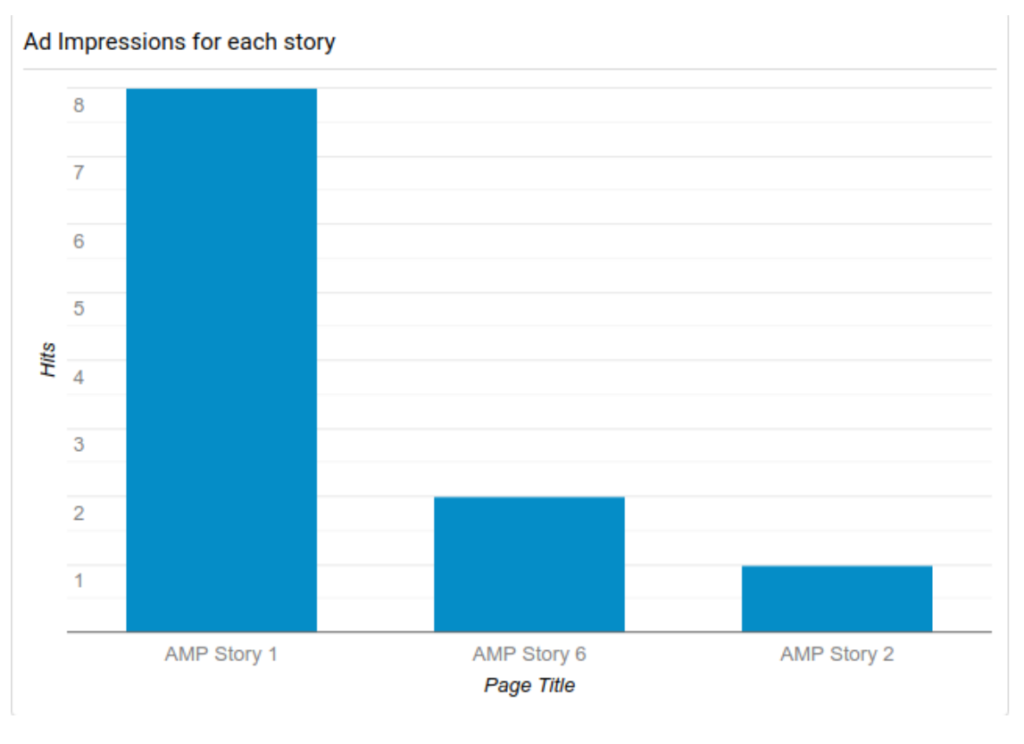
Insight #6: Measure how many times ads were shown on my story
Web Stories can insert ads on your stories via the <amp-story-auto-ads> component. The following setup helps you visualize the number of times ads were shown on the story.
Create a new dashboard or add a widget to an existing one with the following setup:


Conclusion
In this post, we shared various ways of using AMP Analytics with Google Analytics, to measure unique ways in which users interact with Web Stories.
If you have feedback or questions on your Web Story analytics setup, please open a Github issue.
Happy measuring!
Posted by Jeffrey Jose, Product Manager at Google, AMP Project