

Editor’s note: the following guest post was written by
Swetha Gopalakrishnan, Web Ecosystem Consultant, Google
Avneet Singh, Technical Account Manager, Google
Introduction
Measuring the success of AMP pages is crucial for any business. As a developer or an AdOps person in a publishing company, you might be wondering how to measure the quality of your implementation and the monetization of AMP.
This is the first of a 3 part mini series addressing exactly that. We will be sharing best practices and common pitfalls we’ve observed over many publishers whom we have worked with. The mini series consists of:
- How to measure the success of your AMP pages (this article)
- AMP monetization best practices and common pitfalls
- AMP implementation best practices and common pitfalls
Let’s dive in!
There are 3 categories of success metrics you need to measure:
- Traffic (are users landing on AMP pages?)
- User engagement (are users spending time on AMP pages?)
- Monetization (are AMP pages making money?)
Traffic
Objective: Identify if traffic is being channeled to AMP pages.
Metrics to collect:
- Source/Medium traffic split for AMP vs Non-AMP
- Number of sessions starting from AMP
- Cache vs. Non-Cache analysis
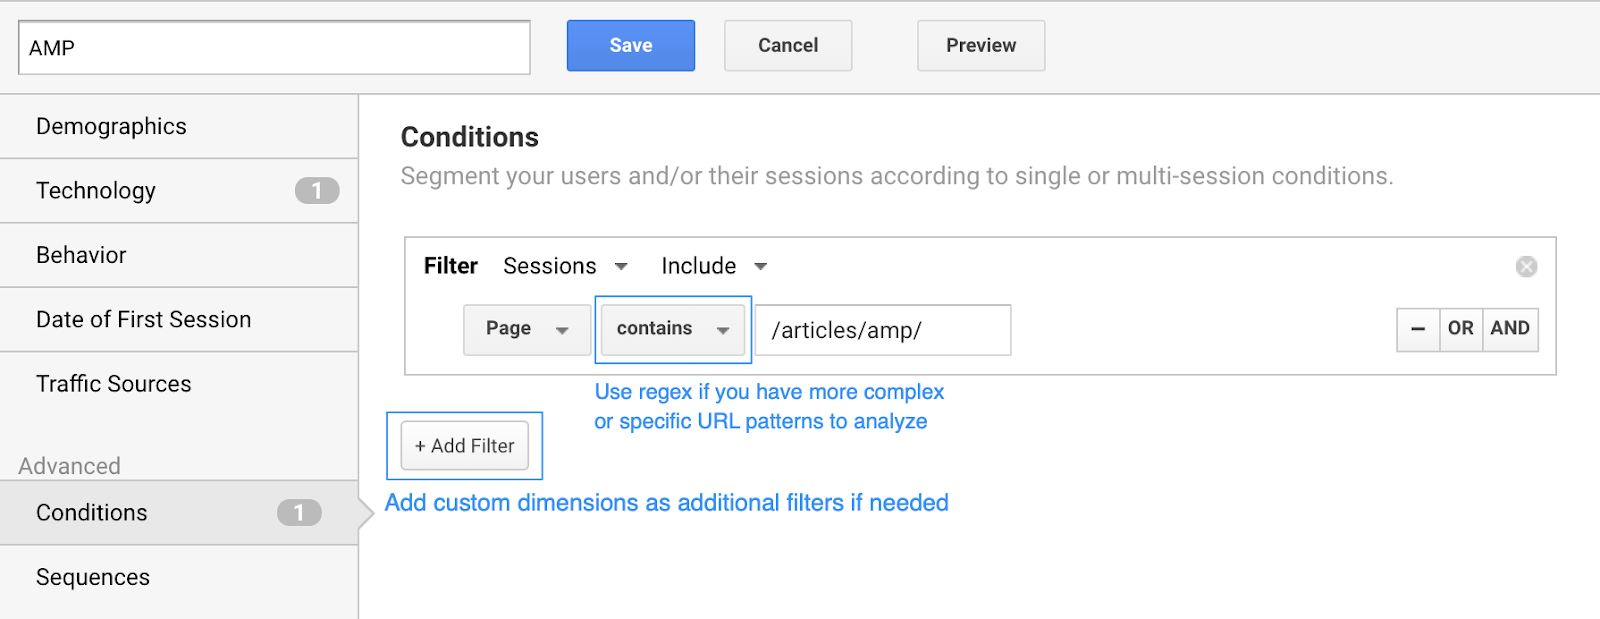
If you are using Google Analytics, you can create a new segment to analyze AMP behavior. For example:


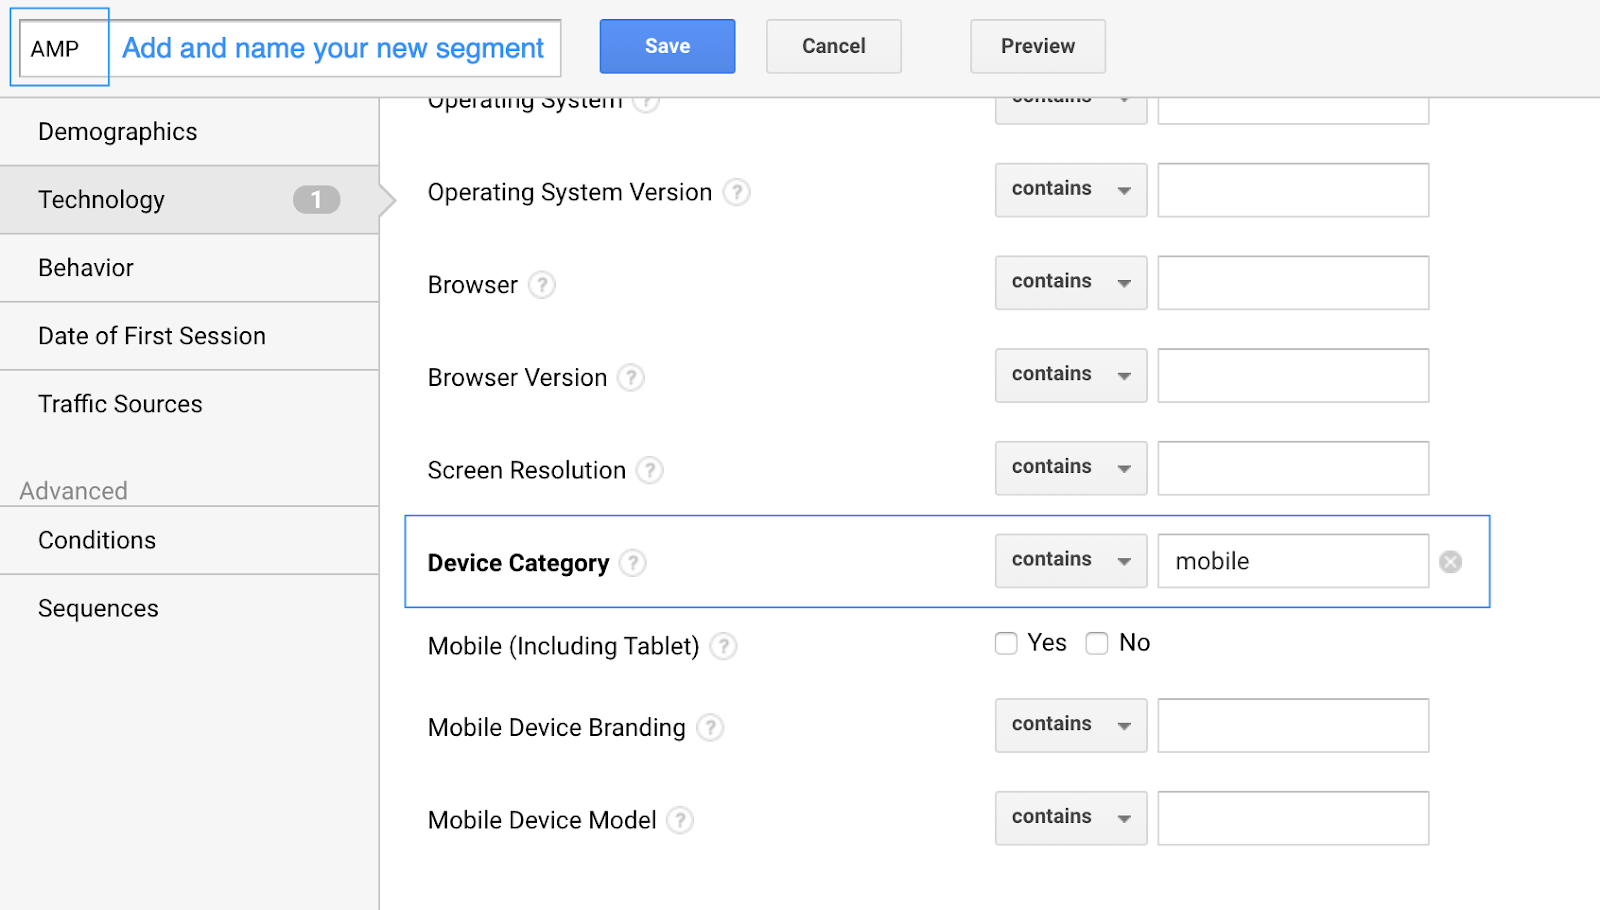

Source/Medium traffic
Look for an increase in AMP traffic across the board. If you would like to compare this report against Non-AMP, remember to add a comparable segmentation for Non-AMP (eg. if only articles are AMP, use a Non-AMP segment filtered for articles only).
If you see referral traffic coming from “example-com.cdn.ampproject.org / referral”, this means that pages served from AMP Cache are incorrectly counted as referral traffic. Ensure that a referral exclusion is added in GA (see step 3) for the AMP Cache domain (eg. example-com.cdn.ampproject.org).
Number of sessions starting from AMP, Cache vs. Non-Cache analysis
The number of sessions starting from AMP give an indication of whether users are discovering and clicking into the AMP pages. Cache vs Non-Cache analysis gives insight into how many users are accessing AMP pages via cache vs directly on your domain.
In order to collect these metrics, add the following custom dimensions into the analytics tracking in AMP pages:
1. Add a new custom dimension via the Analytics interface. Make it a session level dimension and note the index number. This will identify sessions that start from AMP
- Let’s say the index number is 1
2. Add another custom dimension, make it hit level and note the index number. This will track the Number of hits to AMP Cache vs your own domain.
- Let’s say the index number is 2
3. Add the highlighted tracking code into your <amp-analytics> component
<amp-analytics>
<script type="application/json">
{
"vars": {
"account": "UA-xxxxxxx-x"
},
"triggers": {
"trackPageview": {
"on": "visible",
"request": "pageview",
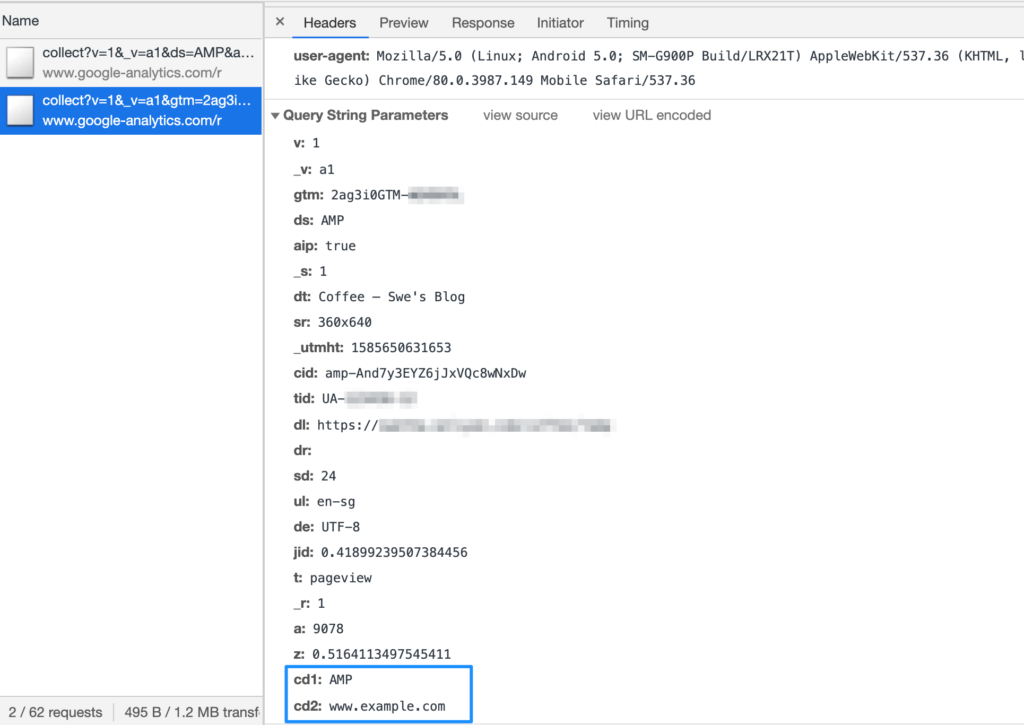
"extraUrlParams": {
"cd1":"AMP", //Identify sessions starting from AMP
"cd2":"${ampdocHost}" //Compare cache vs non-cache traffic
}
}
}
}
</script>
</amp-analytics>
Code language: HTML, XML (xml)4. Relaunch your AMP pages and check that custom dimensions are being sent

5. Access the custom dimension in any of your normal reporting processes (eg. in GA, add the custom metric as a secondary dimension or use in a segment filter)
Case Study: KG Media boosts pageviews and mobile web revenue by increasing AMP traffic
KG Media, one of the largest media groups in Indonesia, is a great example of how channeling traffic to AMP benefitted their business and users. They learned that despite a high adoption rate (87% pages have an AMP equivalent), there was not enough organic traffic coming from AMP. After using GA data to understand user journeys and increasing the Number of AMP pages and traffic, they managed to see a 600% uplift in monthly AMP pageviews and a 34% uplift in overall mobile web revenue! (Read more)
User Engagement
Objective: Assess if users are spending time on your AMP pages and whether you are retaining users on AMP.
Metrics to collect:
- Bounce rate
- Pages per session
Bounce rate:
Bounce rate is when a user opens a single page on your site, triggers a single request to the Analytics server and exits the session without triggering any other requests to the Analytics server. Ensure that the AMP Linker has been implemented and track bounce rates on AMP to assess if users are engaged.
Pages per session:
Measure this metric for users whose session starts from AMP. This can be an indication of the quality of the AMP experience and assess whether users are retained on your site.
If pages per session are not on par with non-AMP, check the UI and feature parity of AMP pages. Ideally, users should not be able to distinguish your AMP and Non-AMP pages (except that it loads faster of course!)
Case Study: KapanLagi.com saw a 50% reduction in bounce rate after AMP Linker implementation
KapanLagi.com, one of the most popular entertainment sites in Indonesia, implemented AMP Linker across several properties and subsequently saw up to 50% reduction in AMP bounce rate (which ultimately reflects the true bounce rate) and a ~3x increase in pages per session for one of their properties. This enabled them to get more accurate insights on user behavior.
Monetization
Transition to a new component framework for mobile web is an exciting new step to improve the user journey. Publishers often ask us what they can do to increase the monetization potential on their web properties without losing focus on a smooth user experience. A faster page load speed and a simplified structure ensures that ads on AMP loads faster, thereby giving users a higher probability to engage with ads on your AMP page. A better viewability and higher CTR paves the way for increasing the chance of better CPMs. The first task, however, is to ensure that you are measuring monetization on your AMP pages correctly.
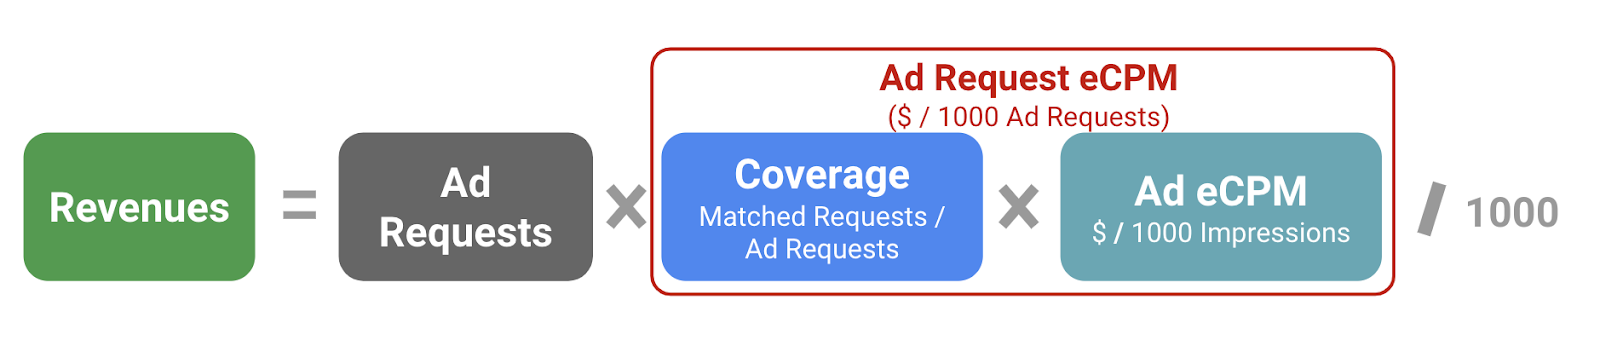
While revenue continues to be the north star metric that we want to maximize, the scale of adoption of AMP pages can be different for different publishers. Hence, our recommendation is to track a new metric which we call ‘Yield’ to compare monetization on AMP vs non-AMP. Yield is the product of coverage (matched requests/ ad requests) to the Ad eCPM. A readily available metric which is a good measure of Yield is the Ad Request eCPM.

To check open auction AMP performance on Google Ad Manager, add filters that help you look at data only for the mobile web and then compare AMP and non-AMP inventory in parallel. This can be achieved by adding filters for setting Products to ‘Display’ and Device Categories to ‘High-end mobile devices’. The dimension ‘Inventory Type’ helps compare AMP and non-AMP inventory perfectly well.


The output for this sample AdX historical report looks like this:


This is a great way to see that even though AMP revenue is half that of non-AMP due to fewer ad requests (usually a good proxy for AMP adoption), the Ad request ecpm and hence yield on AMP is 3x that of non-AMP. This is purely a function of higher Coverage and Ad eCPM. Data points like these can be good indicators for Ad Product Managers to make a business case with the web development team to increase AMP pages and inventory to earn higher revenues.
Publishers on Adsense too can measure their AMP pages performance in a similar way. Under the Content Platform reports, set Device categories to ‘High-end mobile devices’ and choose Content Platform categories to segment data by AMP and Web.
Case Study: JNM saw 3.3x ad requests, higher AMP pageviews and revenue through best practices
Jagran News Media (JNM) made user-centric, data-driven decisions and adopted best practices for ads running on AMP pages. Consequently, they achieved impressive results within a month. Ad requests were 3.3 times higher, generating 15% more mobile web (mWeb) revenue. JNM maintained their momentum by quickly enabling AMP for top traffic landing pages. They subsequently saw 115% more AMP pageviews and 4.5 times more AMP revenue.
Summary
Measuring and monitoring how your AMP pages are performing is key to success and informed decision making. In the coming weeks, we will deep dive further into the following topics:
- AMP monetization best practices and common pitfalls
- AMP implementation best practices and common pitfalls
Additional Resources